


Toilet paper, paper, and industrial paper are indispensable items for us every day. As the provider of our daily necessities, paper mills face huge production demands every day. The stability of production line operation is the most important thing for manufacturers.
The paper production process usually goes through a pulper to add water to the pulp to form a slurry, and then forms the pulp into the shape of paper through the wire section, and then dehydrates and evaporates the water into paper rolls through the water pressing section and the drying cylinder section, and then cuts , labeling, packaging and other post-processing processes become commodities for sale.
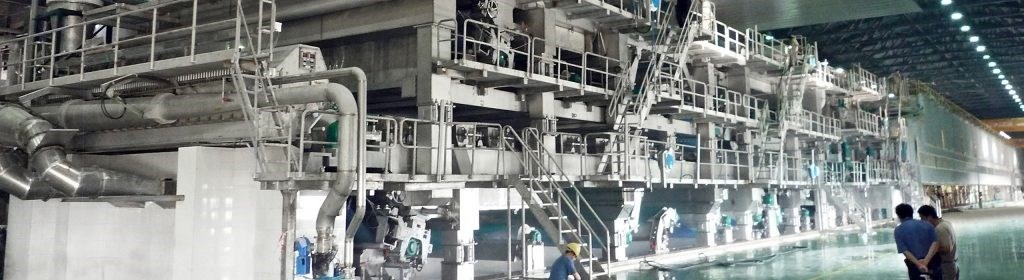
The press water section and drying cylinder section are the largest and most complicated processes in the paper machine, which require a large number of motors to drive the entire conveyor belt, and any motor failure will cause downtime and loss of production capacity, and will also expose on-site personnel in danger. Therefore, it is very important to do a good job in equipment maintenance. However, due to the high cost of establishing a traditional online monitoring system, the factory mainly sends personnel to use handheld devices to conduct regular inspections to check whether the equipment is operating normally. However, manual inspections are usually performed once a week or two, and the equipment is often damaged during the inspection; another bigger problem is that due to the danger of the machine running, the handheld equipment can only measure the rotating elements on both sides of the machine but not the middle of the machine. Equipment makes the production line more uncertain.
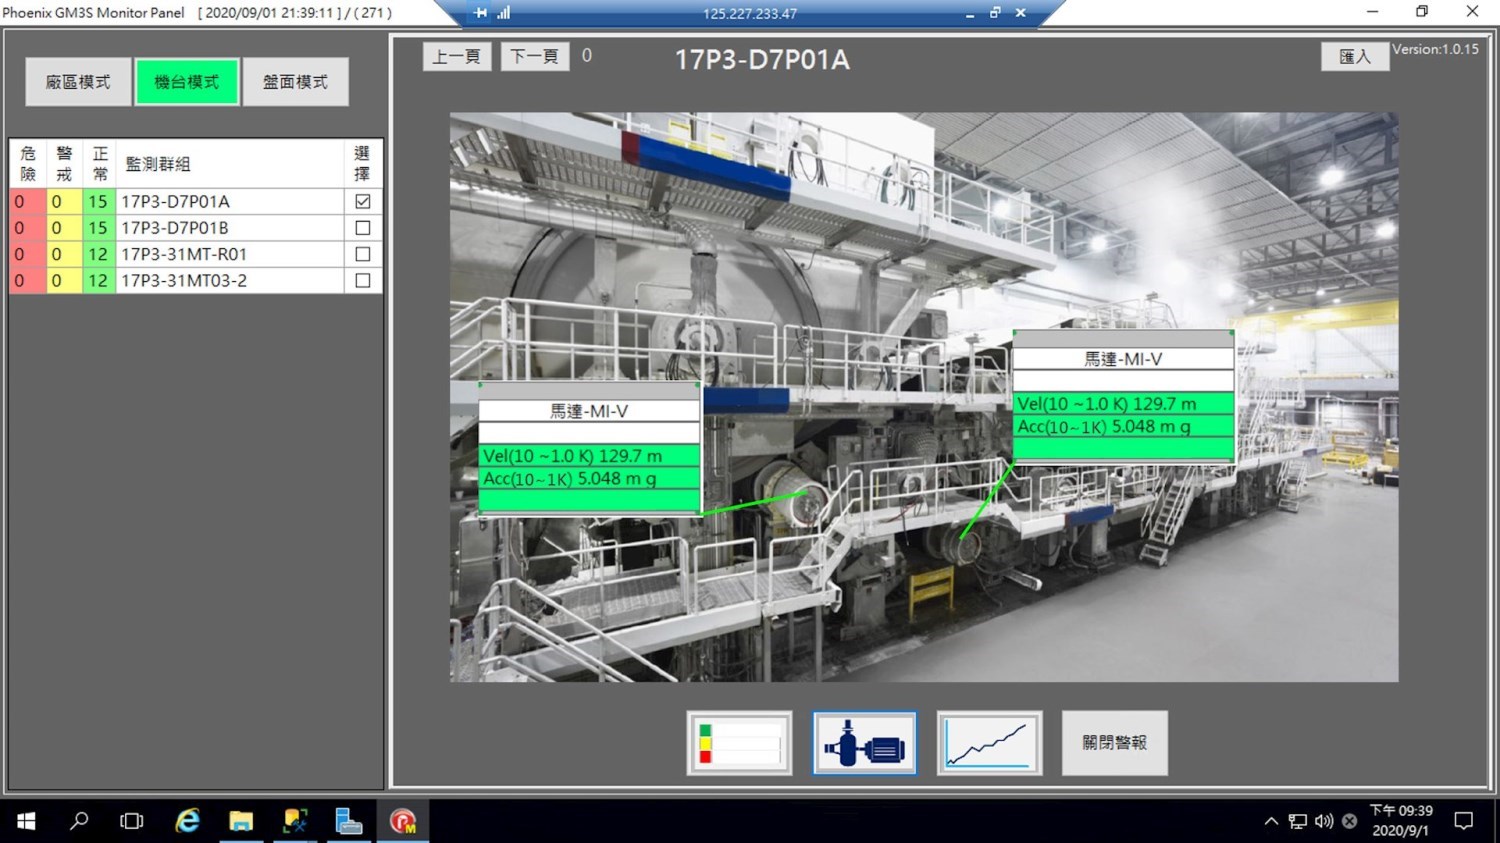
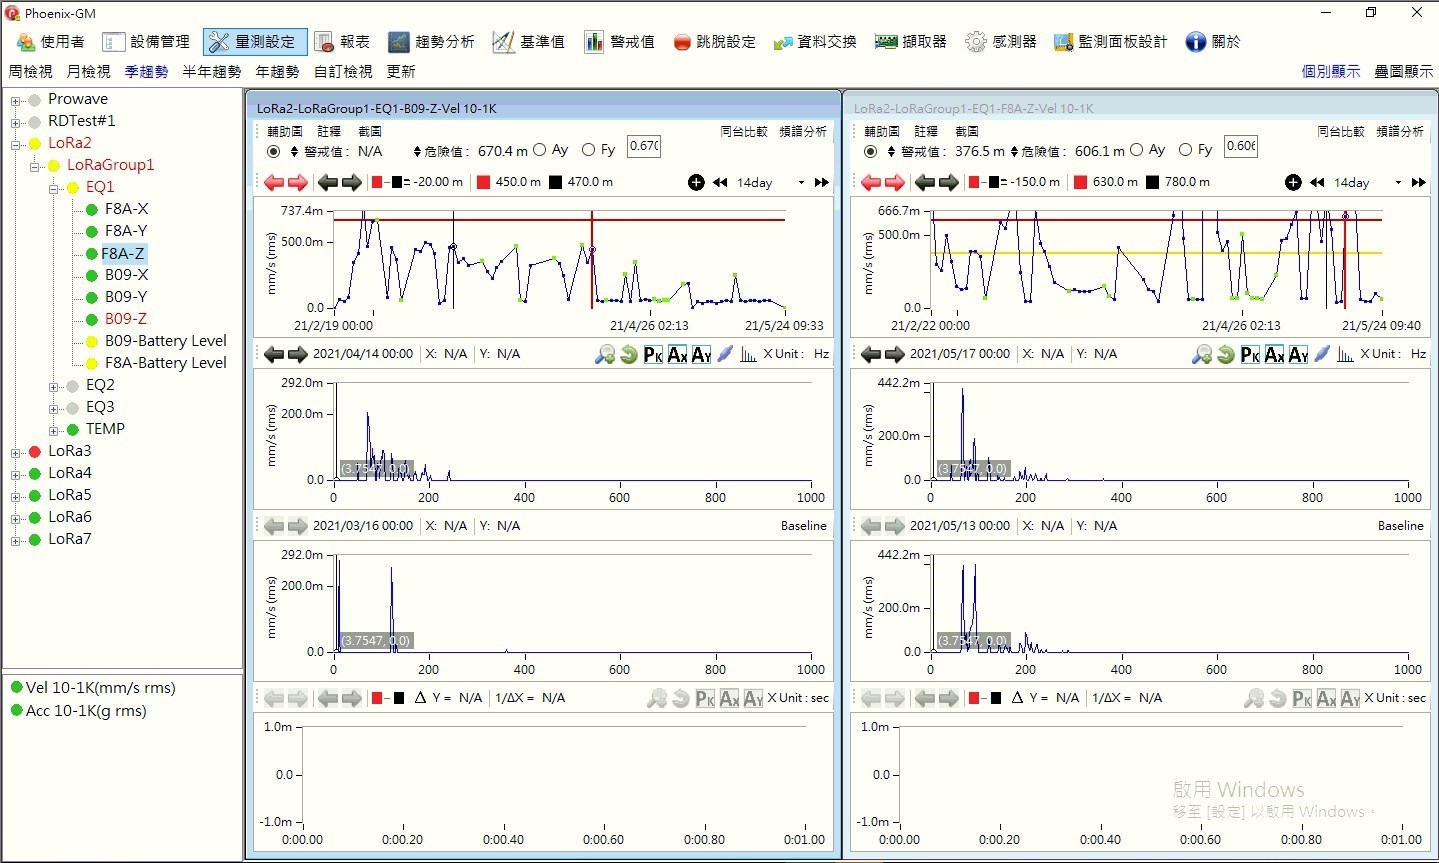
Puwei launched Phoenix GM LoRa, a wireless device monitoring system. Through the LoRa sensor, it has the advantages of low energy consumption and long-distance transmission. It can perform wireless data transmission of hundreds of meters, and can measure vibration and temperature signals. The vibration can not only obtain In addition to the total vibration (OA), one piece of spectrum data per day can also be obtained. Through Phoenix GM3S, the third-generation intelligent equipment monitoring system of Puwei, it is possible to set the baseline and the dangerous value of the equipment alarm boundary, observe the trend change, and perform equipment diagnosis through the frequency spectrum. And the data can be transmitted across the street to the terminal factory system. At the same time, it eliminates the danger of personnel inspection and reduces construction costs, making it a good choice for paper mill monitoring. It has also been successfully introduced into domestic paper mills.
Phoenix GM3S : Phoenix GM3S has been in the field of vibration for more than 30 years. It is also a technical consultant service team approved by the Industrial Bureau of the Ministry of Economic Affairs. The self-developed online equipment monitoring system Phoenix GM has reached the third generation. 800 rotating equipment, 3000 monitoring channels, can provide a variety of data analysis methods such as waveform, spectrum, characteristic frequency and has a complete operation interface, trend analysis, damage alarm reminder, spectrum diagnosis, report and other functions, and supports multiple communication protocols such as MQTT /Modubs/OPC UA and other industrial control protocols can connect the data to the upper layer SCADA. It is a powerful vibration health diagnosis software compatible with alarm and diagnosis functions.
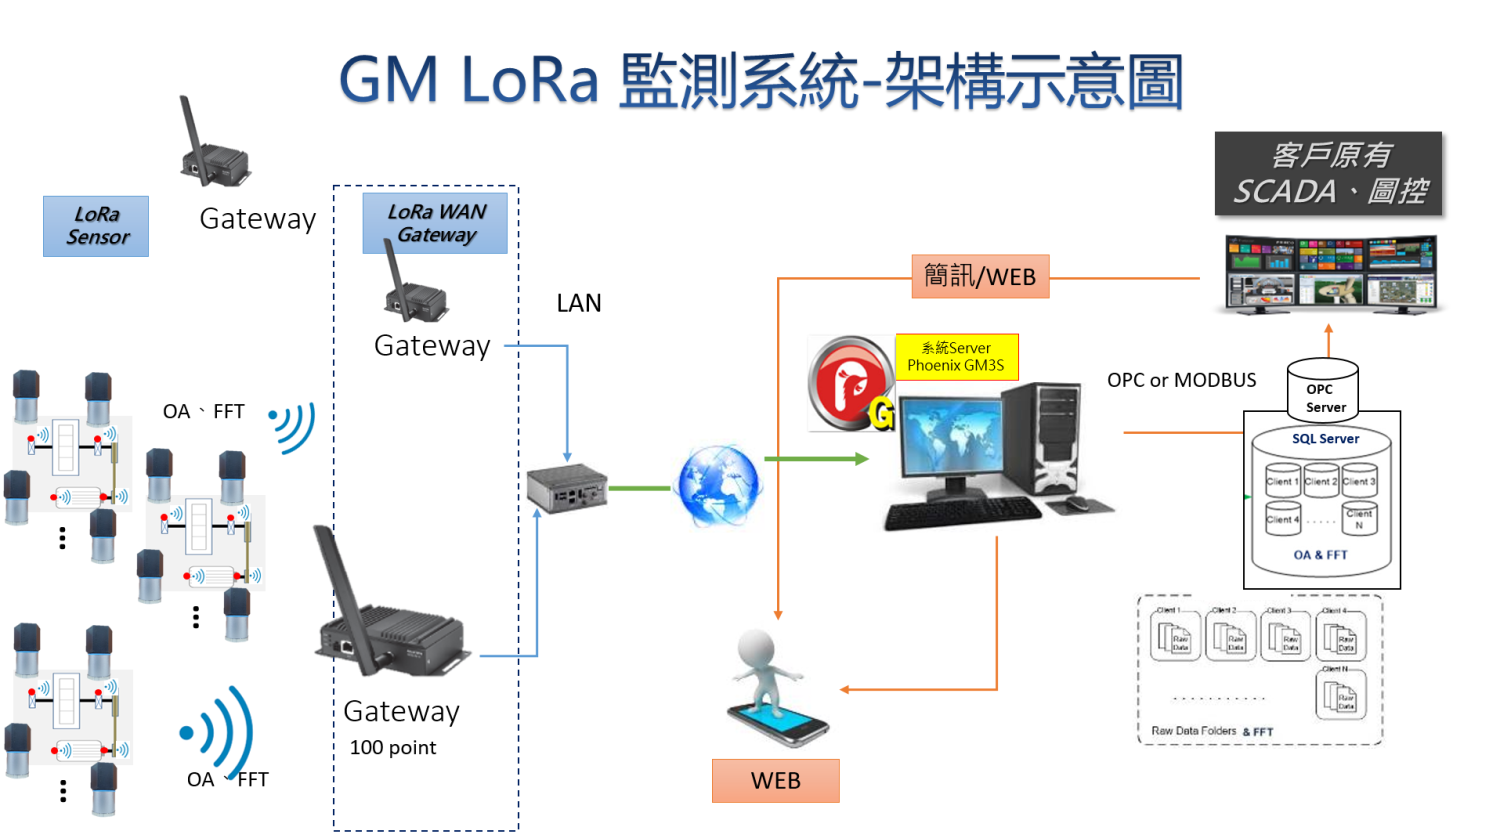
The working method of the system in this case is to use a magnetic base to attach the LoRa sensor to the bearing seat of the motor, pulley and other rotating equipment in the paper machine, and transmit the velocity, acceleration characteristic value (OA) and FFT spectrum to the Gateway through the LoRaWAN wireless network WISE-6610, enter into the Phoenix GM 3S equipment monitoring software, observe the trend change by setting the warning risk value for it, confirm whether the setting is in normal working condition, and compare the spectrum conditions at different times, generate a report, and upload the data to And integrated in the on-site SCADA system.
 |
 |